From the Logs area (Admin > Logs), you can view a history of actions within your Vault. There are multiple pages in this area, each of which displays the history for a distinct type of action.
Note: Audit logs support a precision to one second. Events occurring within a single second may appear in an unexpected order.
How to Export Audit Logs
To export audit logs:
- Navigate to the page for the data you wish to export.
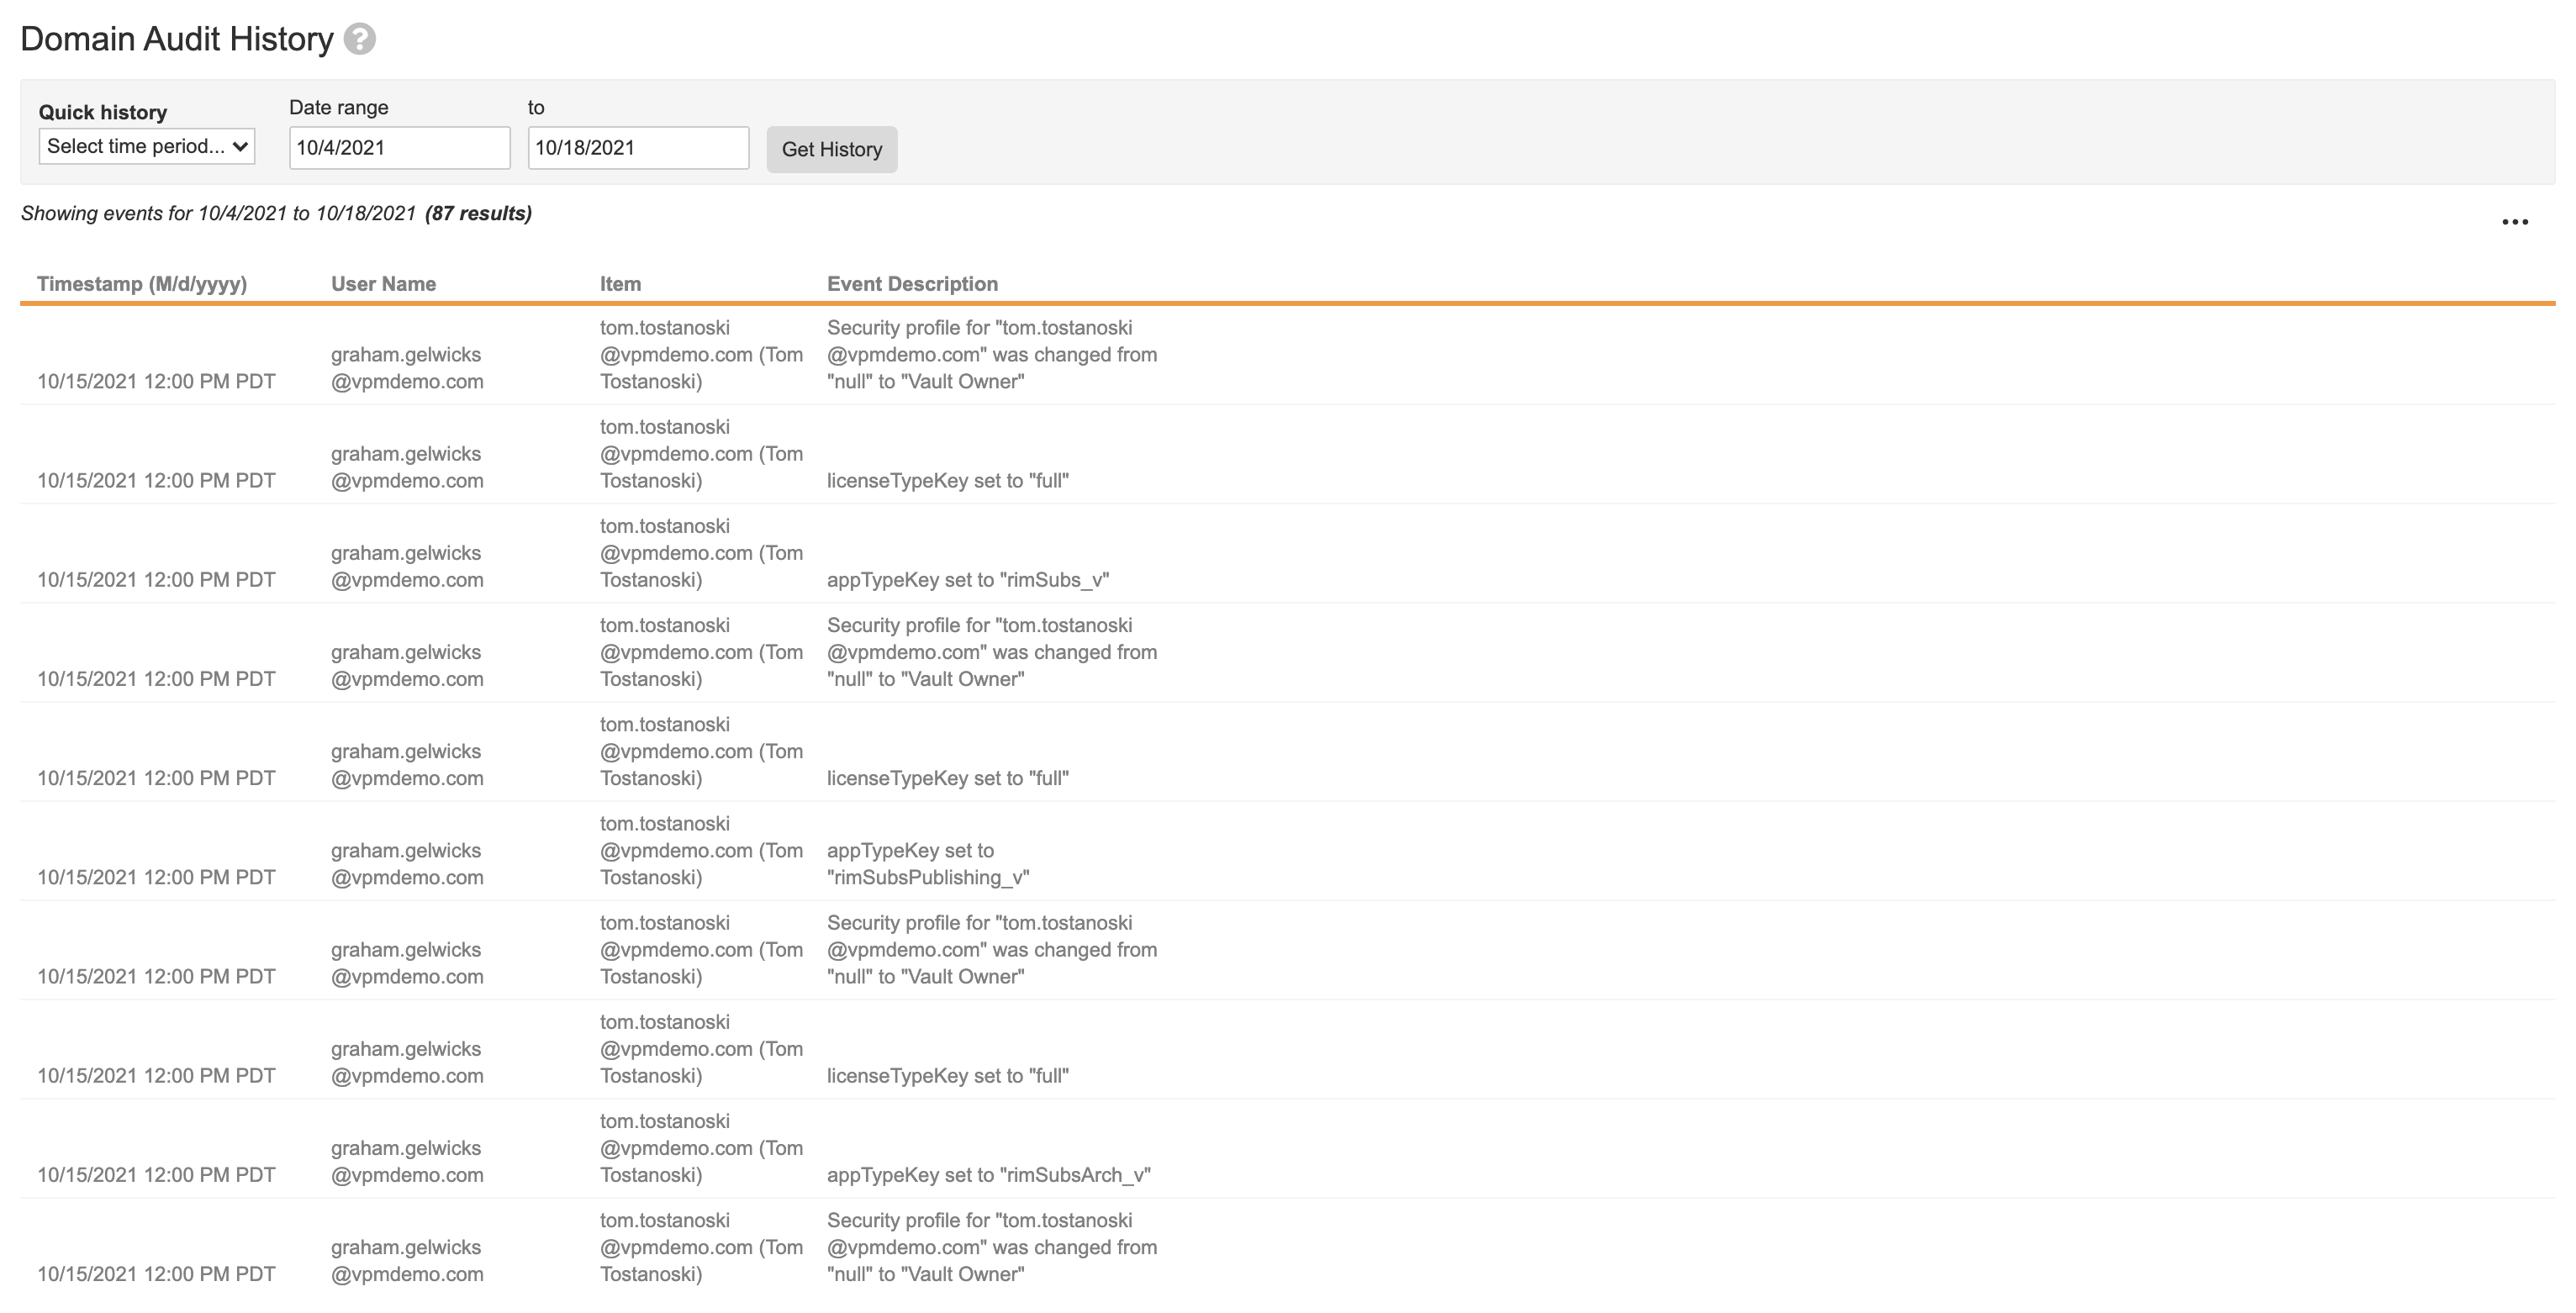
- Optional: When viewing the Domain Audit History, set a date range using the Quick history drop-down. You can also choose a range by entering dates and clicking Get History.
- Optional: When viewing other audit histories, choose from different filter options.
- Click on the Actions menu and choose Export to CSV, Export to Text, or Export to PDF. If the Enable multilingual document handling option is set, only the Export to Text and Export to PDF options will be available.
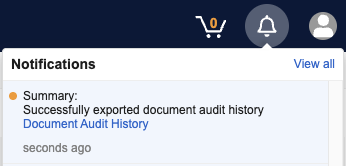
When exporting Object Record Audit History or Document Audit History, Vault sends a notification once the export is complete, and you can download the export file from the notification:
CSV Exports
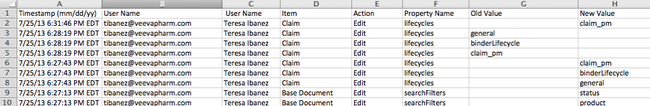
The exported CSV file shows information in a slightly different format. For example, the CSV file separates the details of each event into individual columns.
PDF Exports
When you export as PDF, Vault adds page numbers and a cover page to the PDF. Admins with the correct access can modify the cover page template. All audit histories and audit trails use the same Audit Export Cover Page template.
Note: If an export process exceeds ten minutes, Vault displays a timeout error and instructs you to refine your search criteria.
Export and Retention Limits
Vault includes limits on how many days of results you can view and export in a single request. If you need to export a longer date range, you can export multiple times, changing the date filter each time.
Additionally, Vault only retains some logs for a limited time. Use this table to determine date range and retention limits for a given log:
| Log | Date Range Limit | Retention Limit |
|---|---|---|
| System Audit History | 4 weeks | No limit |
| Login Audit History | 2 weeks; No limit when using Vault ID filter | No limit |
| Document Audit History | No limit | No limit |
| Domain Audit History | 2 weeks | No limit |
| Object Record Audit History | No limit | No limit |
| Debug/SDK Log | 1 day | 30 days |
| API Usage Logs | 1 day | 30 days |
| Queue Logs | 1 day | 30 days |
| Email Logs | 1 day | 180 days |
How to Filter Audit Histories
Filters are available for all audit histories except the Domain Audit History. At the top of the page, by default, the audit history is already filtered by Timestamp is in the last Day. You can select a different time frame from the second drop-down.
To change or add filters for the audit history:
- Select Timestamp, Event, Vault ID, User, or Object from the drop-down. Depending on the page you are viewing, some filters may be unavailable.
- Optional: If you selected Timestamp, select a date range in the drop-down to the right. If you selected in the range, two additional date fields will appear. Click on each field to select a start and end date for the range.
- Optional: If you selected Event, the operator In and a second drop-down will appear. Select the desired events from the second drop-down. If you omit the Timestamp filter, then you will see the history of the specified events for all time.
- Optional: If you selected Vault ID, the operator Equals and a Vault ID will appear by default.
- Optional: If you selected User, the operator Equals and a second drop-down will appear. Select the desired users from the second drop-down. You can select multiple individual users, but not user groups. If you omit the Timestamp filter, then you will see the history of the specified users for all time.
- Optional: If you selected Object, the operator In and a second drop-down will appear. Select the desired objects from the second drop-down. If you omit the Timestamp filter, then you will see the history of the specified objects for all time.
- Optional: Click Add filter to add any of the remaining filters (Timestamp, Event, Vault ID, User, or Object).
- Click Apply to update the table.
System Audit History
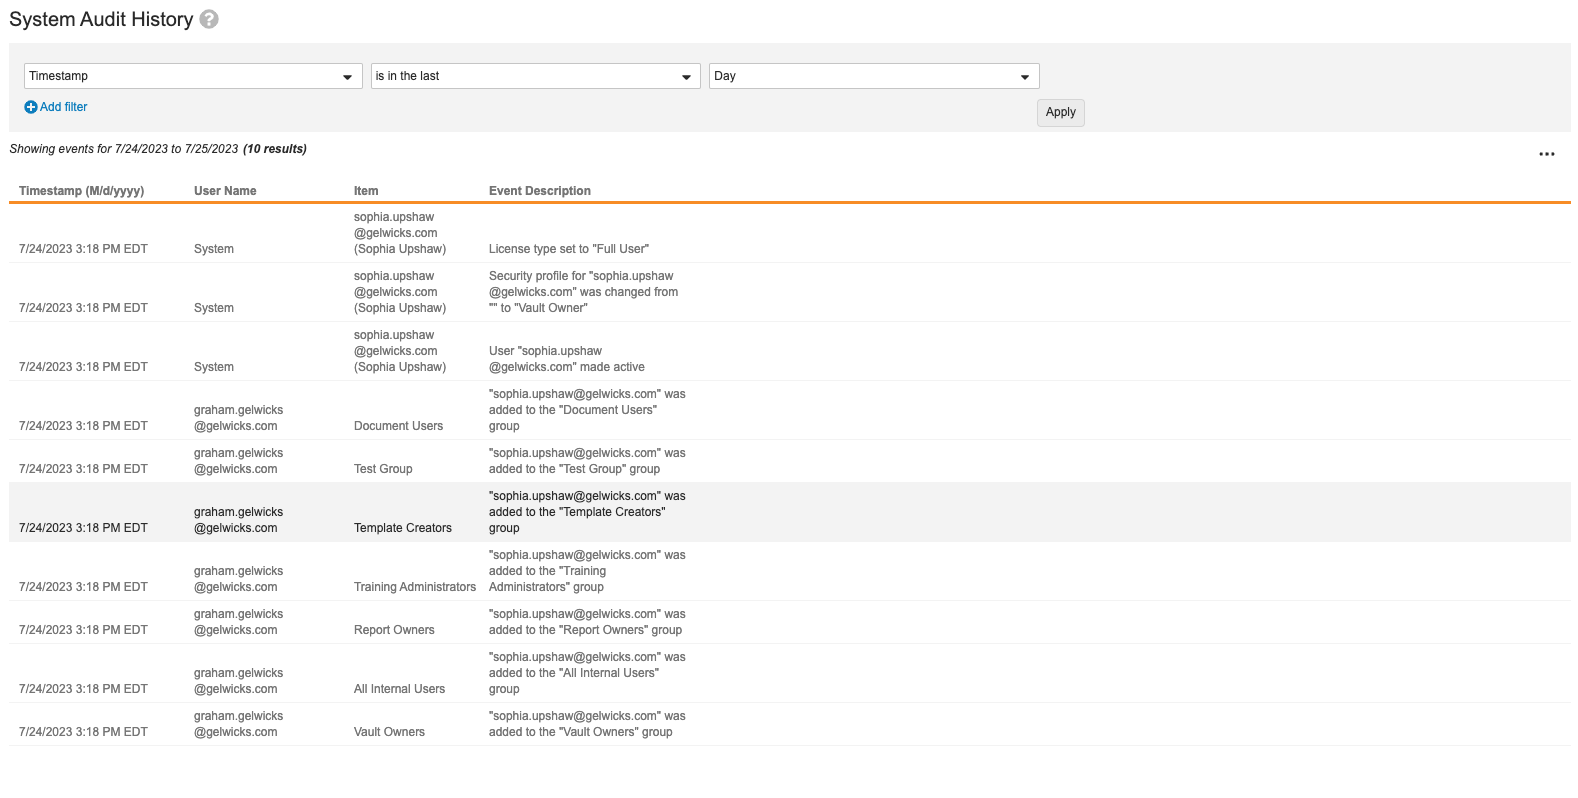
The System Audit History page displays Vault-level configuration and settings changes, for example, updates to document types, workflows, or object configurations. For each event, you can see the timestamp, the user making the change, the affected item, and the description. When users reorder certain components, such as document lifecycle states or user actions, Vault doesn’t capture these changes in the System Audit History.
Login Audit History
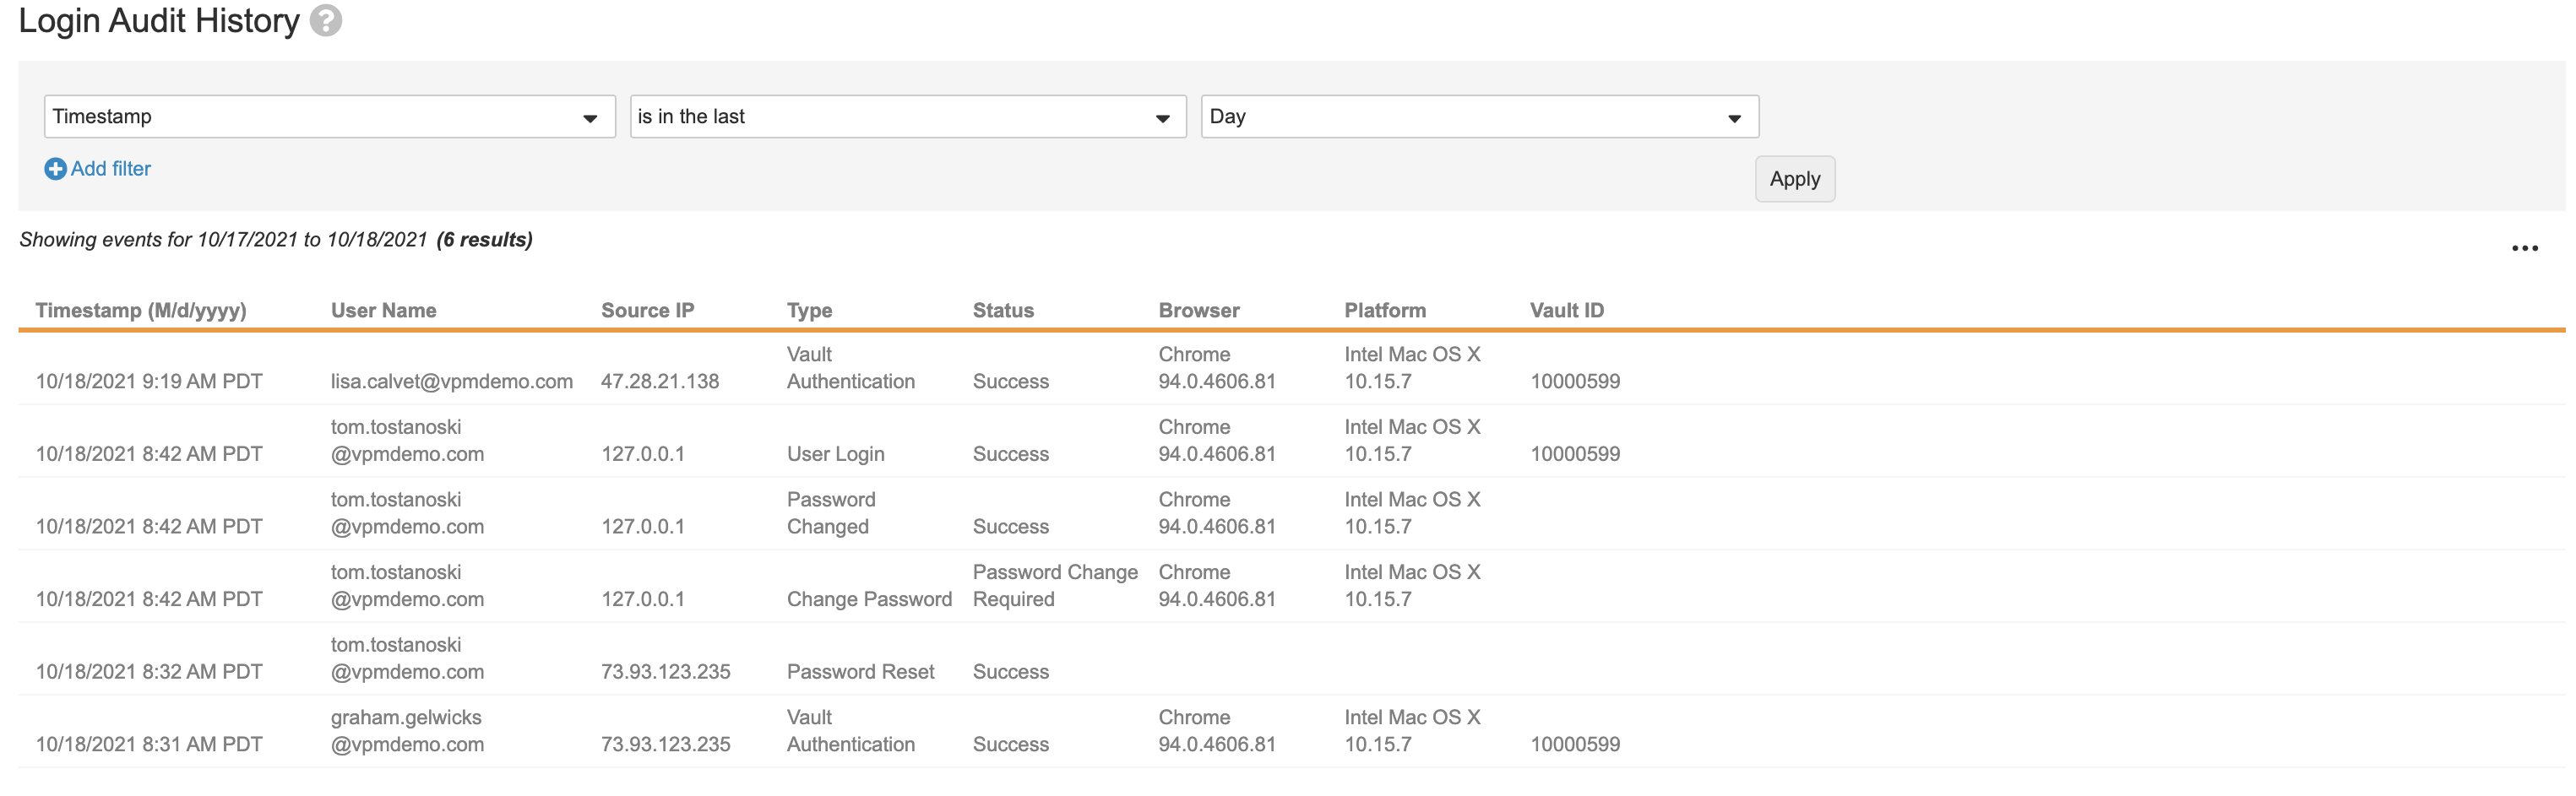
The Login Audit History page displays user authentication events, including users’ logins, failed login attempts, and password changes. For each event, you can see the timestamp, user’s login name, originating IP address, type of event, user’s browser, user’s platform, and Vault ID.
Login Types
Users exist at the domain level and a user login occurs at the domain level. Login Audit History shows Vault-level authentication events each time a user accesses the current Vault. In some situations, it also shows the domain-level authentication.
The Type field tells you which kind of event occurred:
- Authenticate: Indicates that a user submitted their login credentials to provide an eSignature.
- Delegate Access: Indicates that a delegate user logged into the delegated Vault. Vault displays the user name as: [delegate] on behalf of [delegator].
- Enterprise Home Authentication: Indicates a domain-level login event. If there is no additional Vault Authentication event, this user did not access the current Vault.
- My Vaults SSO Login: Indicates that a user logged in using a Single Sign-on security policy and began their session from the My Vaults page or navigated to My Vaults once logged into a specific Vault.
- My Vaults User Login: Indicates that a user logged in to Vault and began their session from the My Vaults page or navigated to My Vaults once logged into a specific Vault.
- OAuth Login: Indicates that a user logged in using an OAuth/OpenID Connect profile.
- SSO Login: Indicates that a user logged in using a Single Sign-on security policy.
- Support User: Indicates that a Veeva employee (Veeva Support, for example) logged into a customer Vault as a read-only user to investigate or troubleshoot a production issue.
- User Login By System: Indicates that the system logged in to Vault on behalf of the user to complete a task. Some examples of when this action occurs include jobs that copy study data from a Vault and jobs that export and import VPK files.
- User Login with device verification: Indicates that a user re-authenticated into a client application by providing device authentication. This only applies to client applications that support Device Enforced App Access.
- User Login: Indicates that a user logged in directly to the current Vault. This type also appears for unsuccessful logins, such as when the user entered the wrong password.
- User Logout: Indicates that a user logged out of the current Vault by clicking Log Out. Vault does not audit user logouts that occur from session timeout due to inactivity.
- Vault Authentication: Indicates that a user accessed the current Vault, after logging into another Vault or logging into My Vaults.
- Vault Switch: Indicates that a user logged in to one Vault and then switched to another Vault without logging out and then logging in.
Last Login Information
The easiest way to find the last login date and time for a specific user is from Admin > Users & Groups > Users.
Note: When a user is evoked using the Vault APIs, the last login date of the User object record is not updated, though the information is correctly logged in the Login Audit History page.
Vault Context for Multi-Vault Domains
Vault user accounts and logins occur at the domain level, which means Admins in multi-Vault domains need to know the specific Vaults where a user logged in. To see the Vault ID for individual login events, view or download the Login Audit History.
Vault ID will appear for the following login event types:
- Enterprise Home Login
- OAuth 2.0/OpenId Connection Authentication
- SAML Authentication
- User Login
- Vault Authentication
Vault ID is only logged for Vault-specific events. For domain-level events, the audit logs will not populate Vault ID. For example, when a user who has not been assigned to any Vaults logs in, that audit entry will not include a Vault ID.
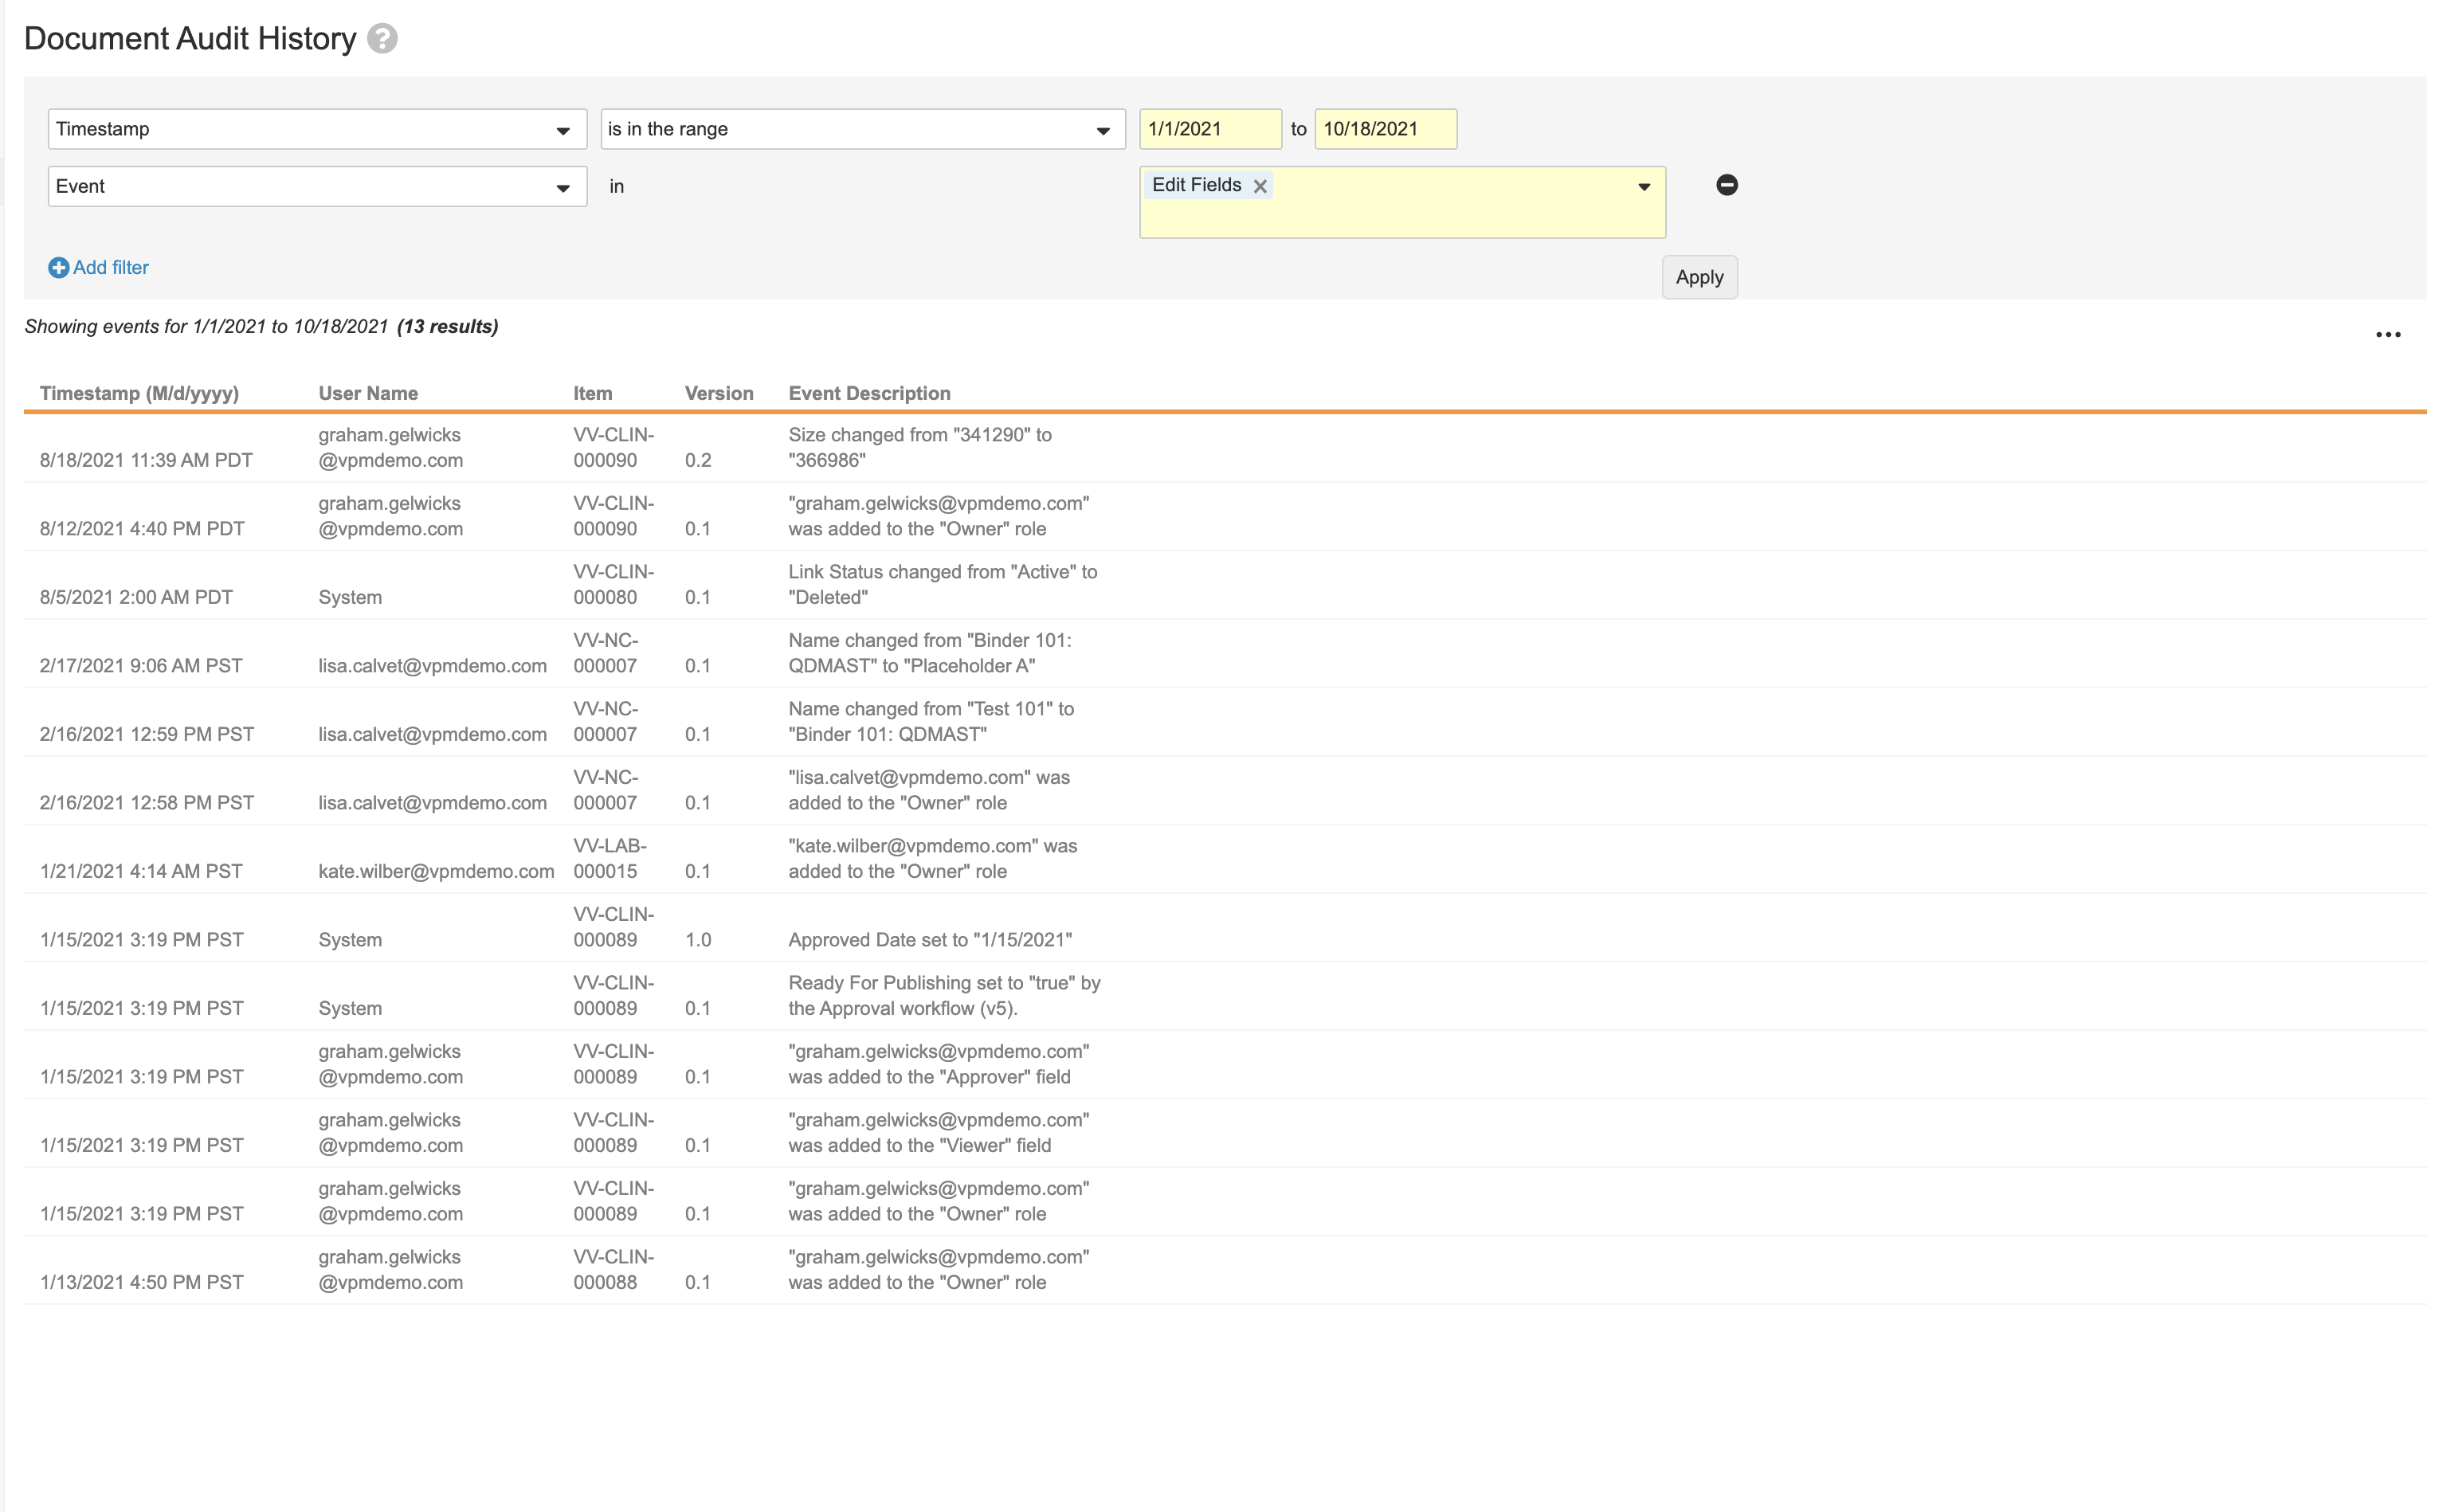
Document Audit History
The Document Audit History page displays document-related events, including views, send as link actions, task completions, and modifications to document fields. For each event, you can see the timestamp, user’s login name, affected item, and description.
Vault does not update documents when a user saves without making any changes. This means that the document’s Last Modified Date is not changed and Vault does not create an event in the document audit history.
Large document audit logs may be stored in file storage and, in certain scenarios, must be exported to view the full log. In this situation, a message is displayed prompting you to export the log to see the full results.
See the complete list of audited actions. Document Audit History includes audit entries for deleted documents, including entries for each document deletion.
The Timestamp filter is required when viewing the Document Audit History log and has a date range limit of 365 days.
Document Audit Log Contents
The columns in the exported document audit log report the following information:
- Timestamp: Date and time when the action was performed, adjusted to your own timezone, accounting for daylight savings time.
- User Name: Username of the user who performed the action. It may show “System” for actions performed automatically by Vault.
- Full Name: Full name of the user who performed the action.
- Action: Name of the action performed on the document.
- Item: The document number.
- Field Name: Name of the document field.
- Old Value: Previous value of the field when data changes.
- New Value: Current value of the field when data changes.
- Signature Meaning: The reason a signature was required for any manifested signature.
- Workflow Name: Name of the workflow.
- Task Name: Name of the task associated with the action.
- View License: Returns a value of “View-Based User” only when the user is assigned that license type. Otherwise, returns an empty string.
- Job Instance ID: The job associated with the action.
- Document ID: Unique ID for the document.
- Version: Version of the document on which the action occurred.
- Event Description: Description of the action that occurred, showing both the previous and new values when data changes.
- On Behalf Of: If the action was performed on behalf of another user, this field represents the delegating user’s name.
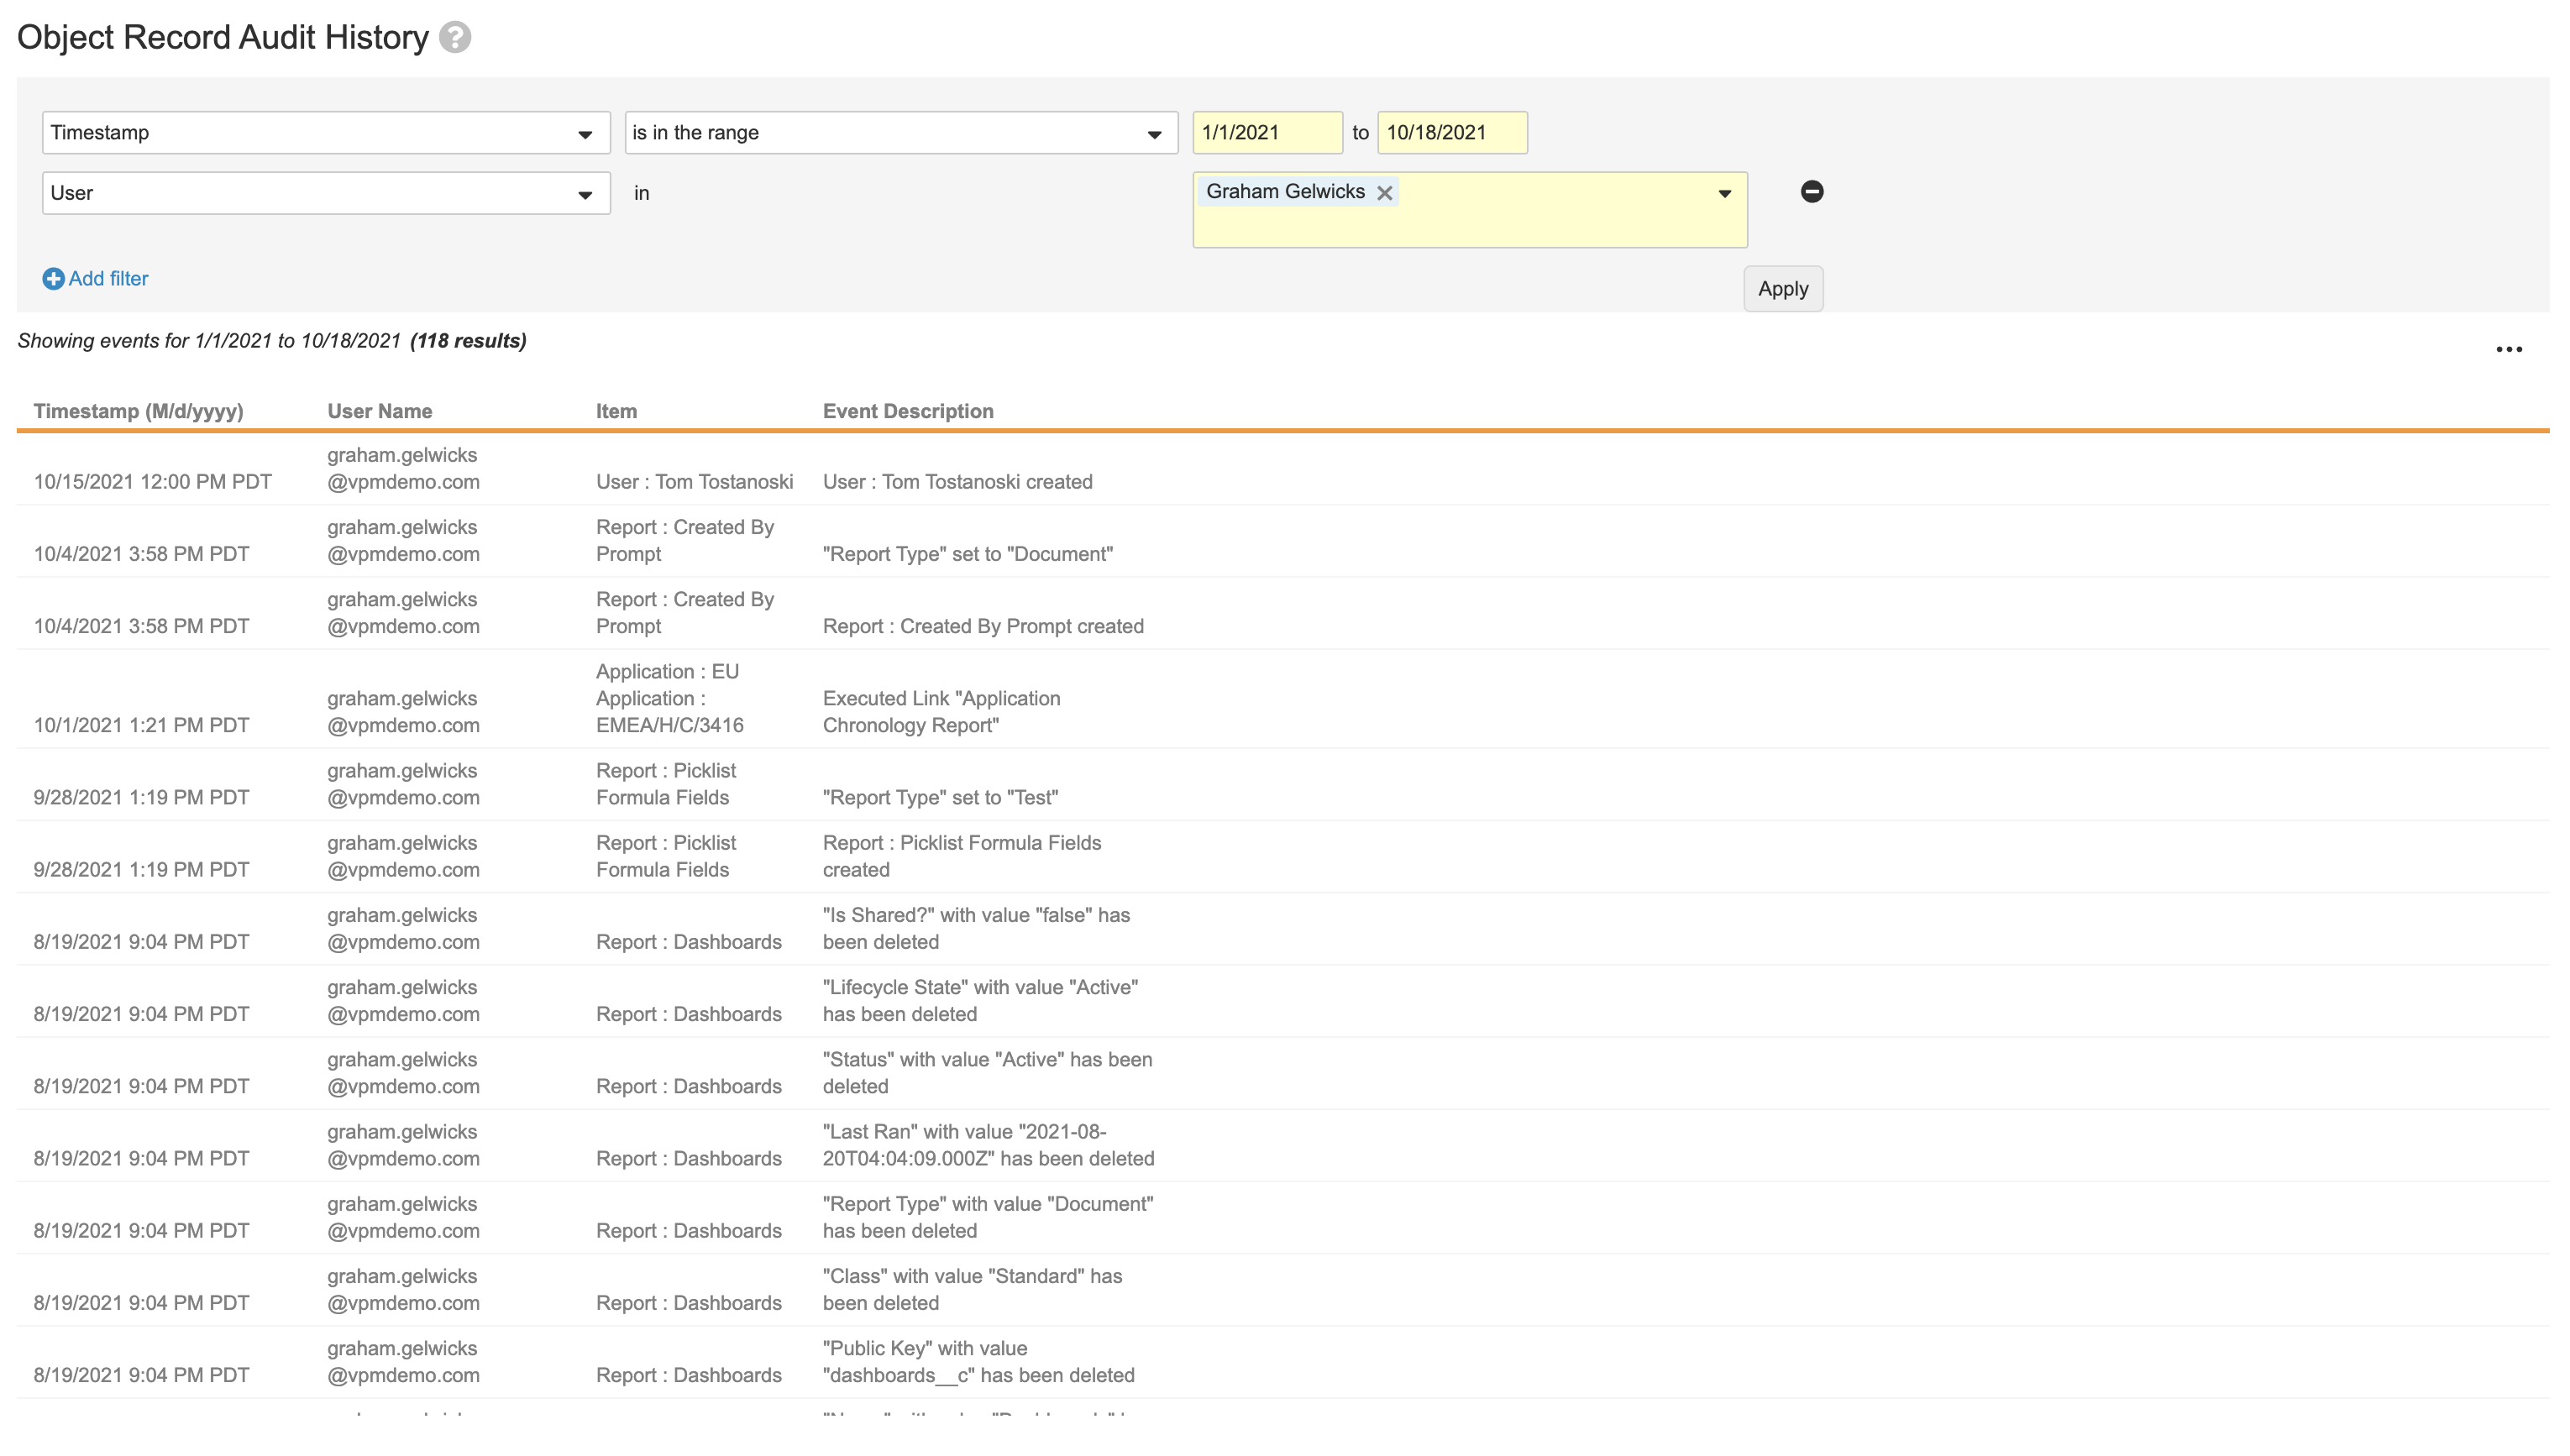
Object Record Audit History
The Object Record Audit History page displays all changes to object records. For each event, you can see the timestamp, user’s login name, affected item, and description. Vault only captures changes to object records when the Audit data changes setting is enabled on that object.
Vault does not audit individual field values for newly created records. For example, the audit trail for a new Product record would only include a single entry, and the Event Description would be “Product: CholeCap created.” We recommend exporting the current record along with the audit trail to ensure a complete export of all values. When a user deletes an object record, the audit trail captures all field values.
Large object record audit logs may be stored in file storage and, in certain scenarios, must be exported to view the full log. In this situation, a message is displayed prompting you to export the log to see the full results.
Vault does not update records when a user saves without making any changes. This means that the record’s Last Modified Date is not changed, triggers do not execute, and Vault does not create an event in the object record audit history.
The Timestamp filter is required when viewing the Object Record Audit History log and has a date range limit of 365 days.
Object Audit Log Contents
The columns in the exported object audit log report the following information:
- Timestamp: Date and time when the action was performed, adjusted to your own timezone, accounting for daylight savings time.
- User Name: Username of the user who performed the action. It may show “System” for actions performed automatically by Vault.
- Full Name: Full name of the user who performed the action.
- Action: Name of the action performed on the object record.
- Item: Name of the object record.
- Field Name: API name of the object field.
- Field Label: Label of the object field.
- Old Value: Previous API name of the field value when data changes (for object and lifecycle state values).
- New Value: Current API name of the field value when data changes (for object and lifecycle state values).
- Old Display Value: Previous display value of the field when data changes.
- New Display Value: Current display value of the field when data changes.
- Record ID: Unique ID for each object record.
- Object Name: API name of the object.
- Object Label: Label value of the object.
- Workflow Name: Name of the workflow.
- Task Name: Name of the task associated with the action.
- Verdict: Outcome of the task.
- Reason: Reason associated with the verdict.
- Capacity: Capacity associated with the verdict.
- Event Description: Description of the action that occurred, showing both the previous and new values when data changes.
- On Behalf Of: Delegating user’s name, if the action was performed on behalf of another user.
Domain Audit History
The Domain Audit History page displays changes that occur at the domain level, including updates to user details, security policies, and network access rules. For each event, you can see the timestamp, user making the change, affected item, and description. Note that the Domain Audit History events are the same when viewed from any Vault in the domain.
As part of the Veeva employee off-boarding process, Veeva inactivates the Veeva employee domain user accounts on all Vault domains, including Veeva Customer Vault domains (for any domain types). When Veeva inactivates such a domain user account, Vault creates the following event in the Domain Audit logs under the System user: “User: <User Name> made Inactive by Veeva Systems.”
Example: “Joe.doe@veevavault.com made inactive by Veeva Systems.”
Vault automatically inactivates all related active Vault user memberships when inactivating a domain user. Vault logs these Vault membership inactivations in the Login Audit history under the System user.
About OAuth / OpenId Connect Authentication Event Logging
When starting and stopping OAuth 2.0 / OpenID Connect event logs, Vault stores the following detailed logging information in the Domain Audit History:
- Timestamp: The time when the event occurred.
- User ID: The user ID of the admin who initiated or ended the capture. When the capture is stopped after ten requests, Vault sets the value to System.
- User Name: The user name of the admin who initiated or ended the capture. When the capture is stopped after ten requests, Vault sets the value to System.
- Type: Vault sets the event type to OAuthSetting.
- Item: The OAuth/OpenID Connect profile name.
- Action: Vault sets to Edit.
- Filed Name: Vault sets to captureAuthenticationEvents.
Developer Logs
The Developer Logs capture details related to your custom Vault Java SDK integrations. Learn more about the Vault Java SDK on the Developer Portal.
Debug Log
The Debug Log captures details about Vault Java SDK errors, which may be errors in your custom code or errors from exceeding time, memory, or size limits. Debug logs are not enabled by default, and must be enabled per user. Once enabled for a user, every request initiated by that user generates a log file.
By default, the Vault Owner and System Admin security profiles have permission to view the Debug Log and set up log sessions for a particular user. To create a debug log for a user, navigate to Admin > Logs > Developer Logs and click Create. Each Vault can have up to 20 users with enabled debug logs.
Debug Log Data
By default, the debug log includes entries for all custom classes and log levels. You can narrow the results to only include certain log levels or classes by applying filters.
Log Level filters for the debug log include the following options:
- ALL: The debug log captures all log entries. This is the default setting.
- EXCEPTIONS: The debug log captures exceptions from Veeva Vault Platform and
RollbackExceptionsthrown by custom code. - ERROR: The debug log captures exceptions and custom error messages created with
LogService#error(). - WARN: The debug log captures exceptions, errors, and custom warnings created with
LogService#warn(). - INFO: The debug log captures exceptions, errors, warnings, and custom information messages created with
LogService#info(). - DEBUG: The debug log captures exceptions, errors, warnings, information, and custom debugging messages created with
LogService#logResourceUsage().
The Include Action Triggers setting is enabled by default and allows the Debug Log to include Action Trigger related data.
Class Filters allow you to restrict debug log entries to only include entries for specific classes. These can be named entry points (RecordTrigger, RecordAction, etc.) or shared code such as user-defined classes.
To filter by class, click Add in the Class Filters section. In the dialog, select the classes you want to include, then click OK. You can include up to ten classes.
Debug Log Expiration
Debug logs expire after 30 days. At the end of 30 days, Vault deletes the debug log and all log files. The Days to Expiration column displays the number of days remaining until expiration. On a specific debug log, the Reset Log button deletes all existing log files and resets the expiration date to 30 days.
Debug Log Limits
Debug logs have the following limits:
- Maximum number of users per vault for which logging can be enabled: 20.
- Maximum log size: 10MB. When the limit is reached, logging immediately terminates, even if the request is incomplete.
- Maximum number of log files: 20. Once the limit is reached, logging stops.
- Maximum days logs are available: Logs are available for 30 days from the day a log is created for a user. At the end of 30 days, the debug log and all log files are deleted.
This log is not always on by default. If you experience issues related to Vault Java SDK, a Vault Owner or System Admin should create a debug log session to assist with troubleshooting. Learn more about how to use and customize the Debug Log on the Developer Portal.
SDK Profiler Log
The SDK Profiler Log allows developers to create SDK request profiling sessions, which allow developers to troubleshoot custom Vault Java SDK solutions and improve code quality by analyzing results at the SDK request level. Through the Vault interface or Vault API, developers and Vault Admins can create profiling sessions that capture all SDK requests that occur while the session is active. SDK profiling sessions can be configured for either one specific user, or all users.
Users with the Admin: Logs: Developer permission can create SDK profiling sessions. To create an SDK profiling session, navigate to Admin > Logs > Developer Logs > SDK Profiler Log > and click Create. In the Profile for User field, select a user to start an SDK profiling session for a specific user, or leave this field blank to start an SDK profiling session for all users. Vault starts the SDK profiling session immediately on creation, indicated by a Status of In Progress. SDK profiling sessions run for either 20 minutes or up to 10,000 SDK requests, whichever comes first. To end a session early, select End Session from the profiler’s Actions menu. Once ended, a session’s Status is Processing while Vault prepares the data, which may take about 15 minutes. Once the Status is Complete, the data is available for download.
SDK Profiler Log Data
Admins can download SDK profiling results as a CSV through the Vault Admin interface and Vault API, which includes one row per SDK request with the following data:
- Timestamp, in UTC
- Initiating user ID and Username
- Execution ID
- Total gross memory, in bytes
- Elapsed time, in milliseconds
- CPU time, in nanoseconds
- Total count of Action Triggers executed and time elapsed for each
SDK Profiler Log Expiration
SDK profiler logs expire after 30 days. At the end of 30 days, Vault deletes the log and all log files. The Days to Expiration column displays the number of days remaining until expiration.
SDK Profiler Log Limits
- Only one SDK profiling session can be active at a time. A session with any Status other than Complete is considered an active session. For example, sessions which have ended but are still Processing are considered active sessions.
- Each Vault can save up to ten SDK Profiler Logs at one time. After reaching the limit of ten, you must delete an existing log or wait for existing logs to expire.
- Each SDK profiling session has a maximum duration of 20 minutes.
- Each SDK profiling session can capture a maximum of 10,000 SDK requests.
Query Profiler Log
The Query Profiler Log allows developers to create VQL query profiling sessions, which allow developers and Admins to identify and analyze the performance of VQL queries in their Vault. This data includes VQL queries executed by Vault API and Vault Java SDK. Using the Vault interface or Vault API, developers and Vault Admins can create profiling sessions that capture all VQL queries that occur while the session is active.
The Admin: Logs: Developer permission is required to create VQL query profiling sessions.
How to Create a Query Profiling Session
To create a query profiling session:
- Navigate to Admin > Logs > Developer Logs > Query Profiler.
- Click Create.
- Enter a Label to identify the query profiling session.
- Optional: Select a user from the Profile for User picklist. This field allows you to create a query profiling session for a specific user. Leave this field blank to execute the session for all users in your Vault.
- Optional: Select the Origin of the queries. Options include ALL, API and SDK. ALL is selected by default and pulls queries from both Vault API and Vault Java SDK.
- Optional: Enter up to 20 query targets using a comma to separate each one. This field filters the query profiling session to only return queries for each query target.
- Optional: Enter the Minimum and Maximum of the Result Count. This field filters the profiling session to return queries based on the number of query results returned. For example, you can filter the profiling session to return queries that return zero results. The Maximum cannot exceed the maximum value of query results configured for your Vault.
- Optional: Enter the Minimum and Maximum of the Query Time. This field filters the queries returned in the profiling session based on the query execution time. Values entered in the Query Time field are validated as seconds.
- Optional: Select the Response Status. This field prompts the profiling session to return queries with a specific status: ALL, WARN, ERROR, or SUCCESS.
Query Profiler Log Data
Admins can download profiling results as a CSV through the Vault interface and Vault API, which includes one row per VQL query request with the following data:
- Timestamp
- Initiating user ID and username
- Query ID and query string
- Execution ID
- Query target, query type (EXECUTE, COUNT, VALIDATE, SHOW) and query origin (API, SDK, or ALL)
- API version of the query
- Response status including error message, warnings, and error type
- Number of records and pages returned and accessed
- Query and subsequent query pages execution time
The downloaded zip file contains a log file with the following naming convention: [vaultid]_[date]_[starttime]_QueryProfiler.csv. For example: 14567_20251201_1033_QueryProfiler.csv. This indicates:
- Vault ID: 14567
- Date: December 1, 2025
- Start Time: 10:33
The date and time are displayed in your Vault’s local date and time.
Query Profiler Limits
- Only one VQL query profiling session can be active at a time. A session with any Status other than Complete is considered an active session. For example, sessions which have ended but are still Processing are considered active sessions.
- Each Vault can save up to ten Query Profiler Logs at one time. After reaching the limit of ten, you must delete an existing log or wait for existing logs to expire.
- Each VQL query profiling session has a maximum duration of 20 minutes.
- Each VQL query profiling session can capture a maximum of 10,000 VQL queries.
Runtime Log
The Runtime Log captures additional logging for Vault Java SDK transactions. Unlike the Debug Log, which is enabled per user, the Runtime Log is enabled per Vault.
The Runtime Log is enabled by default and captures runtime exceptions. To disable logging or capture additional data, Vault Admins with the General Information: Edit permission can adjust options from the Settings > General Settings > SDK Runtime Log Level setting. Adjusting log-level settings to capture additional data may decrease Vault performance. Changing these settings only affects new log entries.
When adjusting log-level settings, you can select Include Action Triggers to include log-level details from Action Trigger operations. This setting is enabled only if SDK Runtime Log Level is not set to DISABLED.
Runtime Log Data
Log-level settings for the Runtime Log include the following options:
- DISABLED: The runtime logs are off. No logs are created.
- EXCEPTIONS: The runtime logs capture runtime exceptions only. This is the default setting and does not have performance implications.
- ERROR: Runtime exceptions and errors. Generally, errors block transactions from proceeding.
- WARN: Runtime exceptions, errors, and warnings. Generally, warnings indicate a potential issue but do not block transactions from proceeding.
- INFO: Runtime exceptions, errors, warnings, and information. Generally, informational messages do not indicate a potential issue and provide general information about the transaction, such as the current memory usage.
Runtime Logs are captured 15 minutes after the Vault Java SDK transaction completes. If you’ve recently encountered an error which is not captured in the runtime log, wait for the transaction to finish and check again.
Your organization’s Vault Java SDK developers can send custom ERROR, WARN, and INFO messages to the runtime logs. Learn more about working the Runtime Logs in the Developer Portal.
Runtime Log Limits
Runtime logs capture data in 5-minute intervals with the following limits:
- Exceptions and system warnings logging: Maximum 10 KB
- ERROR, WARN, and INFO logging: Maximum 40 KB
If a limit is reached, the runtime log captures a LIMIT entry with the error details and stops capturing data. After the current 5-minute period elapses, logging resumes automatically.
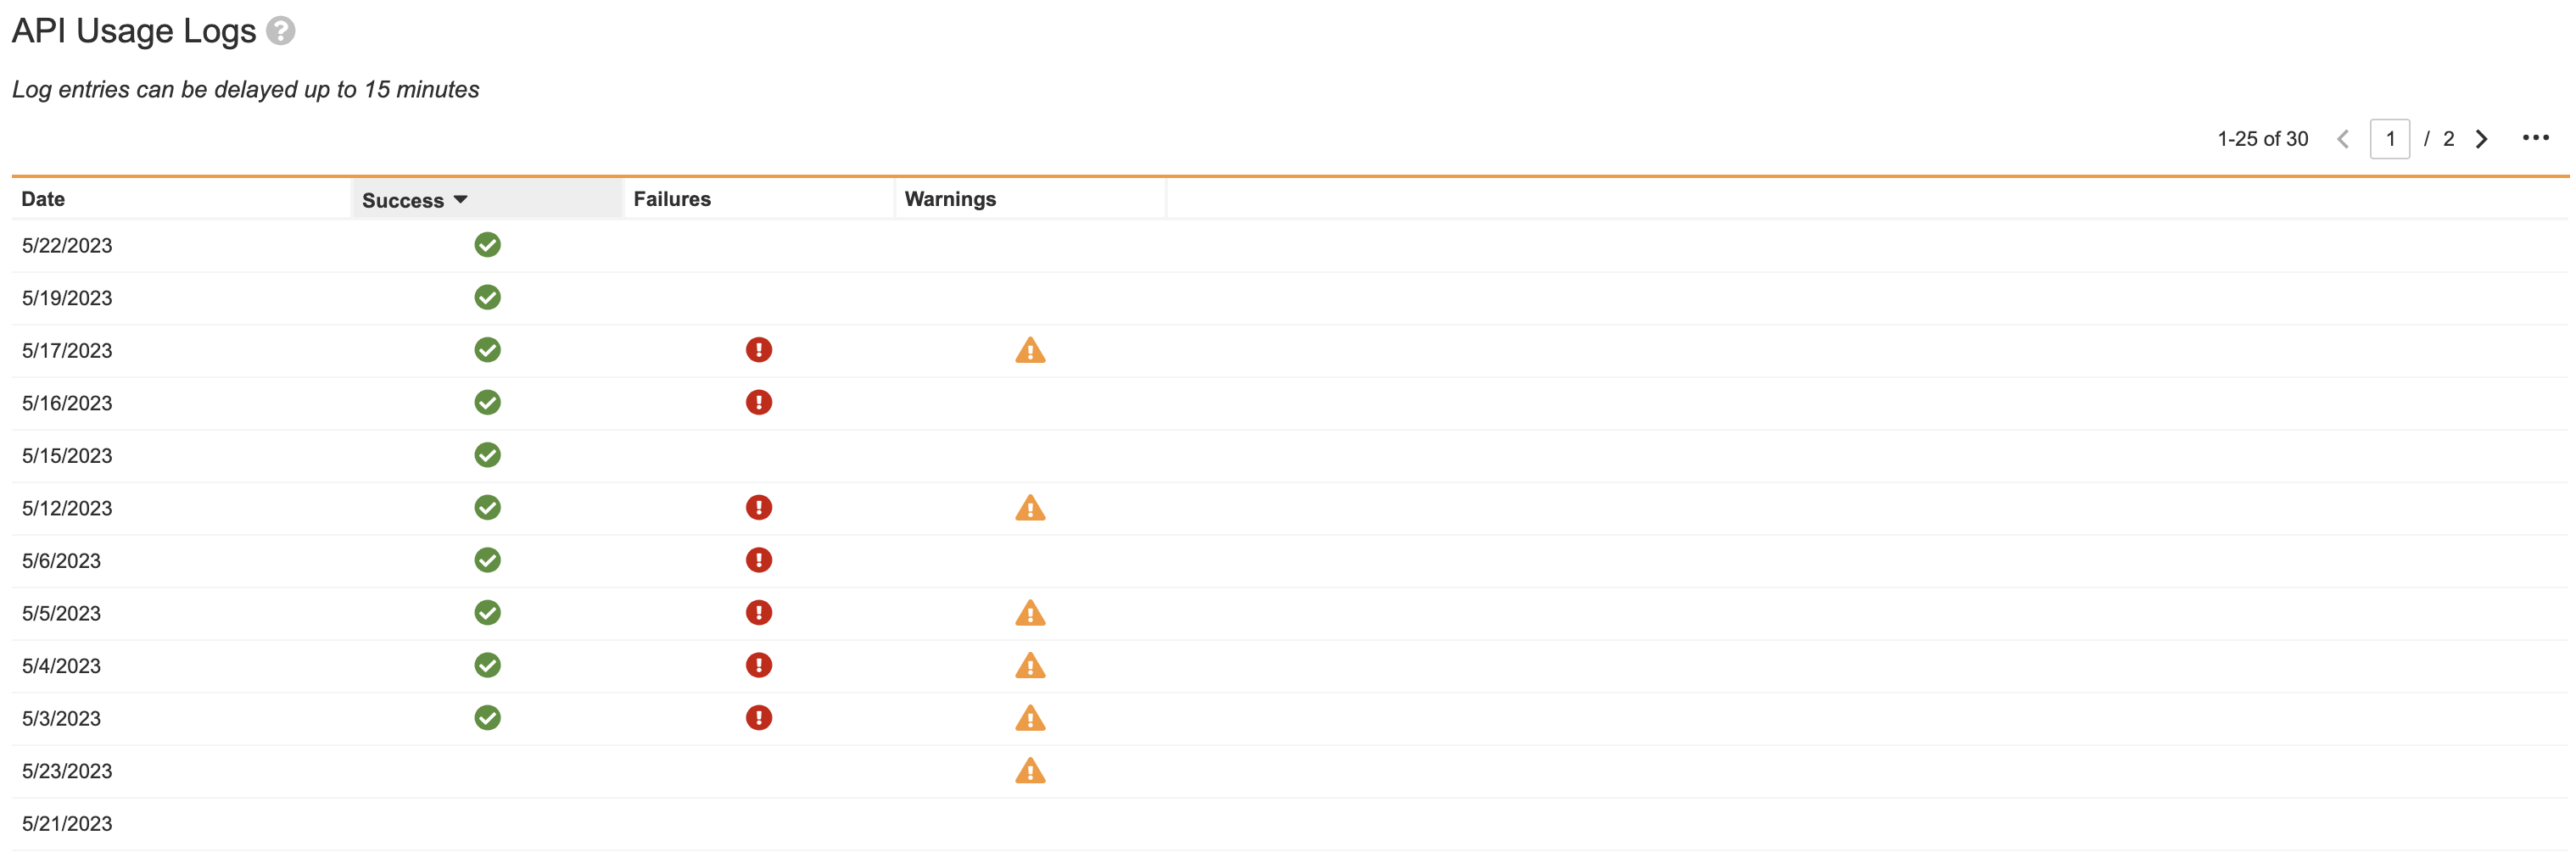
API Usage Logs
You can retrieve the API Usage Log for a single day, up to 30 days in the past. The log contains information such as user name, user ID, remaining burst limits, and the endpoint called. Users with the Admin: Logs: API Usage permission can access these logs from Admin > Logs > API Usage Logs.
The API Usage Logs page includes the Date, Successes, Failures, and Warnings encountered during an API request. From the Actions menu of a log entry, you can Download in CSV format or Download in Logfile format.
Daily logs may have a delay of about 15 minutes. If your log does not include appropriate data, your data is not lost, it is just not yet populated.
The logs are designed for troubleshooting burst limits and discovering which of your integrations are causing you to hit the limit. These logs should not be used for auditing, as they are not designed with the appropriate level of restrictions. For example, if an API request fails to enter the usage log, the API call is not prevented from executing, which would be required if this log was designed for auditing. In rare cases an API call may not show up as an entry in the log, but all calls are accurately reflected in your burst limit counts.
Learn more about API Usage Logs in the Developer Portal.
API Usage Log Contents
The columns in the exported API Usage Log report the following information:
- Timestamp: The date and time of this API request, in UTC.
- Session ID: The Session ID of the user who made the request.
- API Token: The name of the token generated by the API request if a user authenticated with an API token. Learn more about API tokens in the Developer Portal.
- User ID: The ID of the user who made the request.
- Username: The ID of the user who made the request.
- HTTP Method: The HTTP Method of the request, for example,
POST. - Endpoint: The Vault API endpoint used for this request.
- HTTP Response Status: The HTTP response status of the request, for example, 200.
- API Version: The Vault API version used for this request, for example, v18.1. This value is blank for endpoints which do not have an API version.
- API Response Status: The API response status, for example,
SUCCESS. This column may be blank for requests where the response contains binary content, such as files. - API Response Error Type: The API response error type, for example,
INSUFFICIENT_ACCESS. - Execution ID: Unique ID generated by Vault for each API request. Returned in the response header
X-VaultAPI-ExecutionId. - Client ID: The client ID passed with this request. If the API request did not include a client ID, this value is
unknown. If the API received aclient_idwhich was incorrectly formatted, this value isinvalid_client_id. Learn more about Client ID in the Developer Portal. - Client IP: The IP address of the client, which is where the call originated.
- Burst Limit Remaining: The number of API calls remaining in your burst limit. Learn more about API Limits in the Developer Portal.
- Duration: The time it takes an API request to execute in Vault, measured in milliseconds. The duration does not include transport times between Vault and the client.
- Response Delay: This column is populated whenever API calls are throttled and indicates the length of the delay in milliseconds.
- SDK Count: This column is populated if the API request invoked custom Vault Java SDK code, and indicates the total number of SDK entry points executed in this request. Learn more about Vault Java SDK performance metrics in the Developer Portal.
- SDK CPU Time: This column is populated if the API request invoked custom Vault Java SDK code, and indicates the total CPU processing time required for this request in nanoseconds. Learn more about Vault Java SDK performance metrics in the Developer Portal.
- SDK Elapsed Time: This column is populated if the API request invoked custom Vault Java SDK code, and indicates the total elapsed time for this request in milliseconds. Learn more about Vault Java SDK performance metrics in the Developer Portal.
- SDK Gross Memory: This column is populated if the API request invoked custom Vault Java SDK code, and indicates the total gross memory required for this request in bytes. Learn more about Vault Java SDK performance metrics in the Developer Portal.
- Connection: The
api_name__sysof the matching Connection record associated with this request. If this is a trusted Veeva connection, such as Vault Loader, Vault Mobile, or Station Manager, this value isvault__sys. If there is no associated connection, this value is blank. - API Resource: The API resource for the request. For example, the primary query object for a VQL request.
- API Response Warning Type: The API request warning type. For example,
DUPLICATE. - API Response Warning Message: The API request warning message. For example, “Duplicate query execution detected. Consider caching commonly required data.”
- API Response Error Message: The API request error message. For example, “product__b is not a queryable object; please refer to api documentation”.
- Reference ID: The
X-VaultAPI-ReferenceIdheader value. If this header was not included in the request, this value is blank.
Queue Logs
The Queue Logs capture information about the queues running in your Vault. You must have the Configuration: Queues: Queue Log permission to view this log.
By default, the logs only capture undelivered messages. To capture information about all message delivery, you must set the Trace Queue Delivery.
Queue Log Options
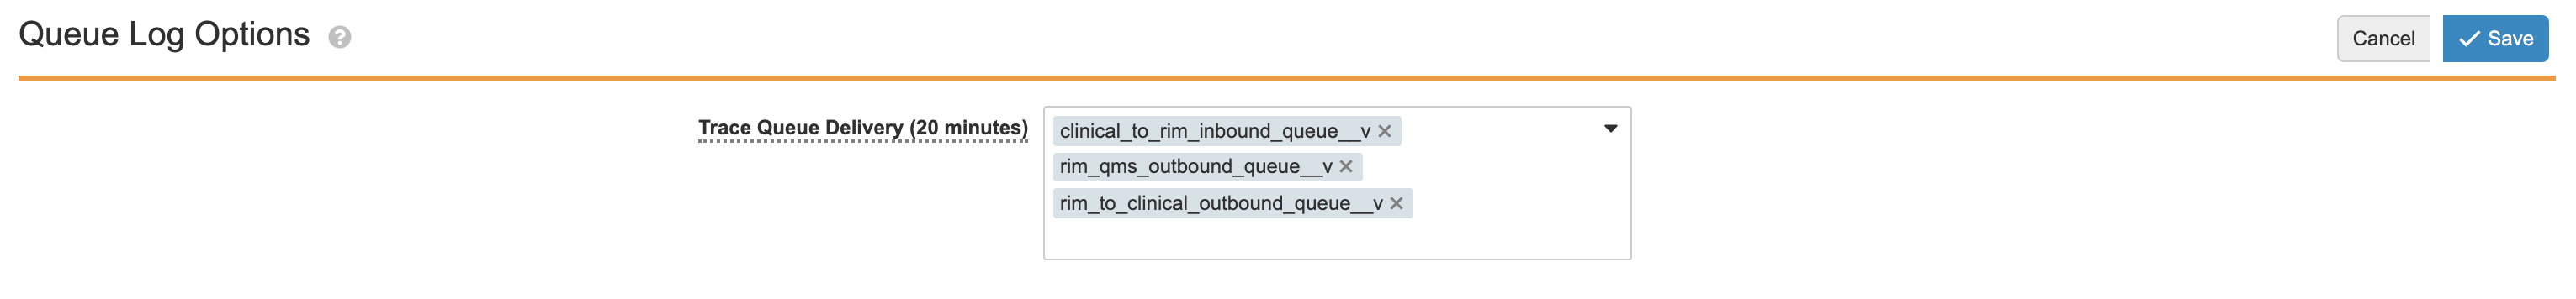
Here you can select queues to Trace Queue Delivery. Queues selected here will enter data into the logs for the next 20 minutes.
To begin capturing all message delivery data:
- On the Queue Logs page, select Edit.
- From the Trace Queue Delivery picklist, select the queues from which you’d like to capture data. By default, you select up to 25 queues.
- Click Save.
Once saved, Vault begins sending data from the selected queues to the logs. After 20 minutes, the picklist is cleared and Vault stops sending data to the logs. If you add or remove queues before 20 minutes has elapsed, Vault restarts this 20 minute period for all queues in the picklist.
Daily Logs
This section contains a log for each of the previous 30 days. After 30 days elapse, the logs begin to delete, starting from the oldest log.
From the Actions menu in the Log Date column, you can download a daily log as a CSV or Logfile.
Queue Log Contents
To learn more about the contents of the queue log, visit the Developer Portal.
Email Log
Every inbound email event is recorded in Vault’s Email log. The previous 180 days of logs are available to view under Admin > Logs > Email Logs. The daily logs may have a delay of about 15 minutes. If your log does not include the appropriate data, know that your data is not lost, it is just not yet populated.
Email Log Contents
The columns in the exported CSV file report the following information:
- timestamp: When the event occurred
- event_type: The type of event that occurred:
- EMAIL_PROCESSED: Successfully processed upon receipt
- EMAIL_PROCESSING_FAILURE: Processing failed upon receipt, with the exception returned from the email processors listed in the details column
- EMAIL_BOUNCED: Bounced, with a reason listed in the details column, and no record listed in email_record (as no Email records are created for bounced email)
- EMAIL_REPROCESSED: Successfully processed after performing the Reprocess Email user action
- EMAIL_REPROCESSING_FAILURE: Processing failed after performing the Reprocess Email user action, with the exception returned from the email processors listed in the details column
- EMAIL_DELETED: The Delete Email user action was performed, and all subsequent columns other than email_record will be blank
- sender_email
- recipient_email
- sent_time
- email_subject
- email_record: The Name field from the Email record created or deleted by this event. This field is blank if an Email record was not created (for EMAIL_BOUNCED events, for example).
- details: This field shows processing exceptions returned from email processors after a failure, or one of the following bounce reasons:
- VIRUS_DETECTED: Bounced for containing a virus
- SPAM_DETECTED: Bounced for being spam
- UNKNOWN_RECIPIENT: Bounced for not being sent to a configured Inbound Email Address
- SENDER_NOT_ALLOWED: Bounced for coming from an email address that doesn’t match an Approved Sender for the Inbound Email Address
- FAILED_SPF_CHECK or FAILED_DKIM_CHECK: Bounced for failing sender verification
- SENDER_BLOCKED: Bounced for coming from an email address on a blocklist that is maintained internally by Veeva at their discretion to prevent abuse or malicious behavior in exceptional cases
Workflow Activity Log
All details related to workflow activity and decisions are recorded in the Workflow Activity log. Admins with the Admin: Logs: Workflow Activity Log permission can view this information under Admin > Logs > Workflow Activity Log. Admins can use this information to analyze and troubleshoot workflow performance. One Workflow Activity log is generated every day and is available for 90 days. The daily logs may have a delay of about 15 minutes. If your log does not include the appropriate data, know that your data is not lost, it is just not yet populated.
From the Actions menu of a log entry, click Download in CSV format to view and analyze the data. The exported CSV file captures details related to the start of the workflow, each step in the workflow, the end of the workflow, and administrative actions, such as updates to the workflow due date, addition of participants, and replacement of the Workflow Owner.
Some columns in the CSV file display values in JSON syntax. You can use Excel’s Power Query tool to parse and analyze JSON syntax values.
Workflow Activity Log Contents
The columns in the exported CSV file report the following information:
- workflow_id: A unique ID identifying the workflow process instance. You can find the workflow ID in the workflow details within the Timeline view or on the Active Workflows page.
- workflow: The Name field value from the workflow.
- version: The workflow configuration version associated with the active workflow.
- step_id: A unique ID identifying the execution of a workflow step.
- step: The Name field value from an executed workflow step.
- state: The Name field value from the workflow’s lifecycle state.
-
event: The type of event that occured:
- WORKFLOW_STARTED: The workflow instance was initiated.
- WORKFLOW_COMPLETED: The workflow instance was completed.
- WORKFLOW_CANCELED: The workflow instance was canceled.
- STEP_STARTED: A workflow step was initiated. This event is also logged when a workflow Start step is displayed to a user or a user initiates a workflow without the Start step displayed to them.
- STEP_COMPLETED: The execution of a step is completed.
- CONDITION_EVALUATED: A condition in a Start step, Decision step, Action step, cancelation action, entry criteria, or entry action was evaluated.
- ACTION_EXECUTED: An Action step or cancelation action was executed.
- TASK_ASSIGNED: A task was assigned or reassigned to a user, or made available to participants. The result column displays the user or group the task was assigned or reassigned to, the number of users to which the task is made available, or the number of users who accepted the task.
- TASK_CANCELED: A task was canceled.
- TASK_COMPLETED: A user completed a task.
- TASK_DUE_DATE_UPDATED: A user updated a task’s due date.
- TASK_UPDATE_SHARING_SETTINGS: The sharing settings actions for a task were updated.
- TASK_NOTIFICATION: A task notification or task reminder was sent to a user or group.
- WORKFLOW_DUE_DATE_UPDATE: A user updated the workflow’s due date.
- PARTICIPANTS_ADDED: The Add Participants action was executed.
- WORKFLOW OWNER REPLACED: The Replace Workflow Owner action was executed.
- EMAIL_PARTICIPANTS: The Email Participants action was executed.
- STATE_CHANGE_STARTED: The execution of a lifecycle state change began.
- STATE\CHANGE_COMPLETED: The execution of a lifecycle state change ended.
- ENTRY_CRITERIA: Execution of entry criteria validation actions.
- ENTRY_ACTION: Execution of entry actions.
- ERROR: The workflow execution encountered a rollback exception.
- WORKFLOW_RESUME: The workflow instance was resumed manually by a Workflow Owner.
- REPLACE_PARTICIPANTS: The Replace Participants action was executed on a legacy workflow.
- condition: Displays the condition rule Label and configuration defined in Start step rules, Decision steps, Action steps, cancelation actions, entry criteria, and entry actions.
- result: Displays the result of a logged event. This includes information such as results of condition evaluations (TRUE or FALSE), names of the next workflow step after a STEP_COMPLETED event, label and configuration of an executed workflow action or entry action, number of items affected by an event, error types, and other workflow step information related to an event.
- status: The status of a step after it is executed (completed or error).
- details: User input needed to complete a workflow step or action, such as verdicts, comments, eSignatures, and selected participants during a task or workflow initiation. Also captures error messages when a step or action encounters an error and completion status of jobs in Job steps. For example, details for a Start step could include:
{"due_date__c": "11/1/2025", "participants__c": 10, "variable__c": "value"}, and details for a task could include:{"verdict":"approved","comments":"No issue found"}. - user: User ID of the user who executed an action or event in the workflow, such as starting the workflow, completing a task, or updating a workflow due date.
- object: Name field value of the object in the workflow. Only logged for object workflows.
- record: Record ID of the record in the workflow. Only logged for single record workflows. If multiple records are in the workflow, record IDs are logged for individual records when one of the following events occurs on a specific record: ACTION_EXECUTED, STATE_CHANGE_STARTED, STATE_CHANGE_COMPLETED, ENTRY_CRITERIA, ENTRY_ACTION.
- document: Version ID of the document in the workflow. Only logged for single document workflows. If multiple documents are included in the workflow, version IDs are logged for individual documents when one of the following events occurs on a specific document: ACTION_EXECUTED, STATE_CHANGE_STARTED, STATE_CHANGE_COMPLETED, ENTRY_CRITERIA, ENTRY_ACTION.
- start time: UTC formatted date and time when an event occurs.
- end time: UTC formatted date and time when an event ends.